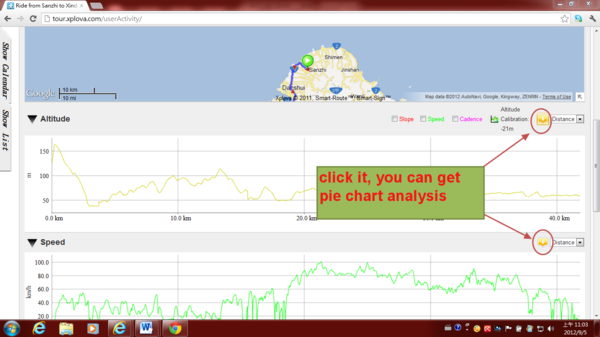
The activity contain main six data. But also can be shown by pie chart.Just go to select the orange "i" (Zone), contains the Altitude, Speed, Cadence, HRM, Power and temperature data, all can be presented in a pie chart analysis.
A)“pie chart” function
----------------------------------------------------------------------------------------------
1) Before click the "i " Hot key to operate “pie chart” function
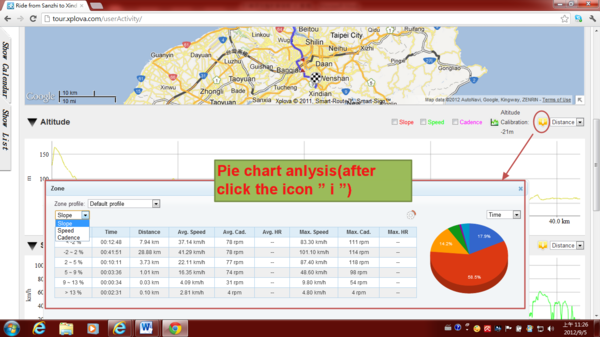
2) Pie chart anlysis(after click the icon ”i”)
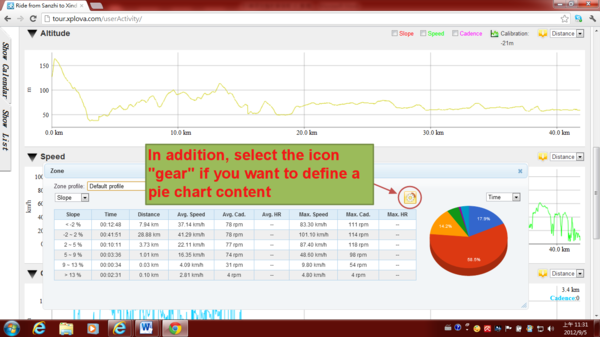
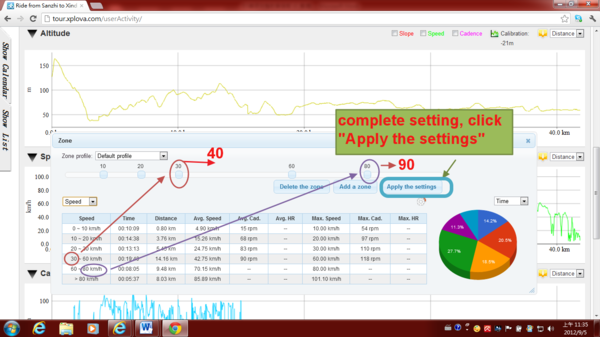
3) In addition, select the icon "gear" if you want to define a pie chart content
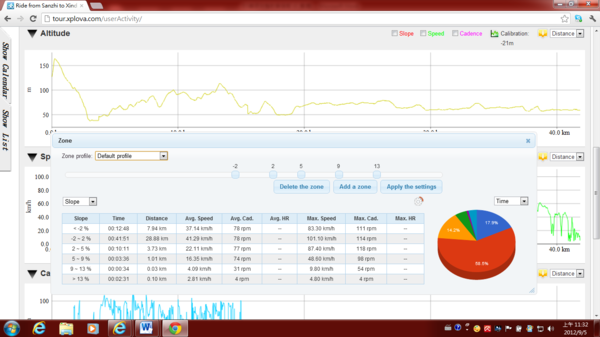
4) You can adjust the data-setting, the pie chart will be re-analyzed, as shown
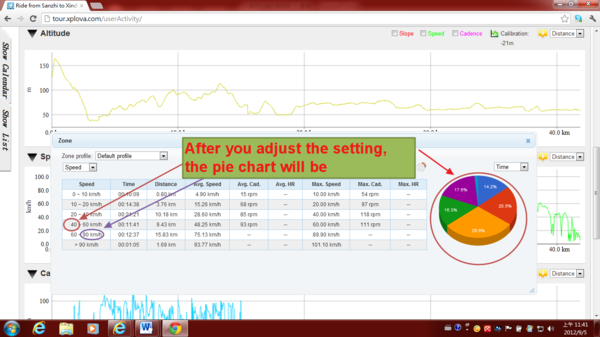
5) After you adjust the setting, the pie chart will be re-analyzed, as shown
6) tour.xplova.com cloud data analysis can be customized.
If you want to adjust your heart rate pie chart analysis,
you can refer to the setting about your aerobic zone, anaerobic zone.
The Settings can reference the following,
According to Physical Fitness guidebook published from American College of Sports Medicine (ACSM) ,
they defines per minute maximum heart rate = 220 – age.
If your heart beats over your maximum heart rate (MHR) data, it show your physical condition is very dangerous. You have to ease cardiac stress. The optimum cardiovascular training zone is found between the 70 and 85 percent training intensities.
Based on the maximum heart rate, divided into three exercises.
calories burnt exercise: MHR *0.6~MHR*0.75/per minute
aerobic exercise: MHR*0.75~MHR*0.85/per minute
anaerobic exercise: over MHR*.085~MHR*1/per minute
For example: Your age is 20 years old in 2012
MHR/per minute =220-20 =200 (200 times of heartbeat every minute)
calories burnt exercise:=200* 0.6~200* 0.75 =120~150
aerobic exercise =200* 0.75~200* 0.85= 150~170
anaerobic exercise =200* 0.85~200* 1 =170~200
When your heart rate is over 200, you must reduce the intensity of exercise.
If you want to lose fat, you need engaged exercise for more than 20 to 25 minutes. For 20 to 25 minutes later, the use of free fatty acids within the muscle will increase. During aerobic exercise, it can consume more fat.
-----------------------------------------------------------------------------------------------------
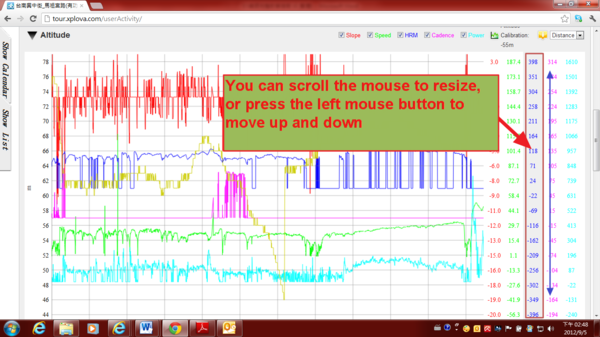
1) Altitude, Speed, Cadence, Heart rate, Power and Slope can present in the same chart.
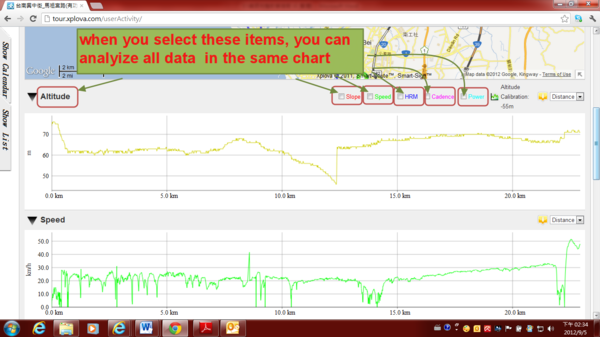
2) Using an integrated chart to render each data
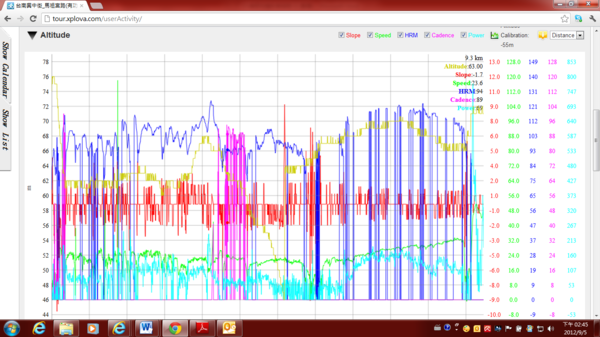
3) You can scroll the mouse to resize, or press the left mouse button to move up and down
下一則: [Xplova E5 Lecture] Edit Activities Function
限會員,要發表迴響,請先登入


