The correct title of this topic is  and R chart. R means Range here.
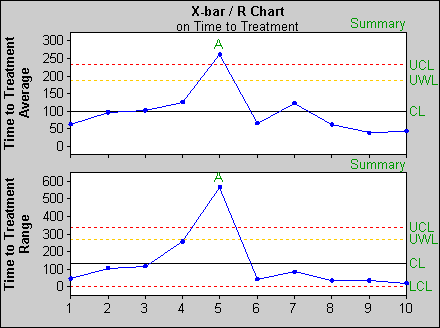
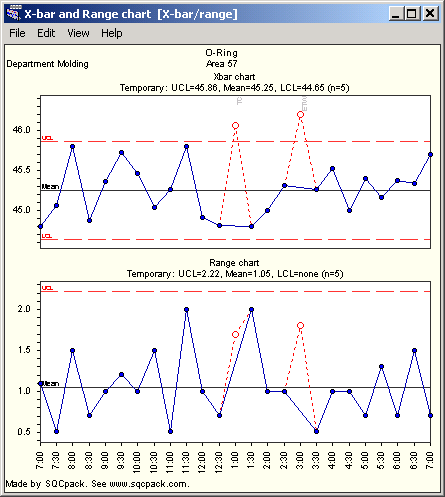
An X-bar and R chart is a pair of control charts used with processes that have a subgroup size of two or more. The standard chart for variables data, X-bar and R charts help determine if a process is stable and predictable. Always look at the Range chart first. There should be more than five distinct values plotted, and no one value should appear more than 25% of the time. If there are values repeated too often, then you have inadequate resolution of your measurements, which will adversely affect your control limit calculations. After reviewing the Range chart, interpret the points on the X-bar chart relative to the control limits. Never consider the points on the X-bar chart relative to specifications, since the observations from the process vary much more than the subgroup averages.
a. Calculate the average range (Rbar):
Rbar = SR/k
where k is the number of subgroups.
b. Plot Rbar on the range chart as a solid line and label.
c. Calculate the overall process average (Xdbar):
Xdbar = SXbar/k
d. Plot Xdbar on the Xbar chart as a solid line and label.
e. Calculate the control limits for the R chart. The upper control limit is given by UCLr. The lower control limit is given by LCLr.
UCLr = D4Rbar
LCLr=D3Rbar
where D4, D3, are control chart constants that depend on subgroup size (see the table below).
f. Plot the control limits on the R chart as dashed lines and label.
g. Calculate the control limits for the Xbar chart. The upper control limit is given by UCLx. The lower control limit is given by LCLx.
UCLx = Xdbar + A2(Rbar)
LCLx = Xdbar - A2Rbar
where A2 is a control chart constant that depends on subgroup size (see the table below).
h. Plot the control limits on the Xbar chart as dashed lines and label.
If the R chart is in statistical control, the process standard deviation, s, can be calculated as:
s=Rbar/d2
where d2 is a control chart constant that depends on subgroup size (see the table below).
To calculate control limits and to estimate the process standard deviation, you must use the control chart constants D4, D3, A2, and d2. These control chart constants depend on the subgroup size (n). These control chart constants are summarized in the table below. For example, if your subgroup is 4, then D4 = 2.282, A2 = 0.729, and d2 = 2.059. There is no value for D3. This simply means that the R chart has no lower control limit when the subgroup size is 4.
平均數-全距管制圖(X-bar R Chart)
- The sample size is relatively small (say, n ≤ 10)
- The sample size is constant
- Humans must perform the calculations for the chart


限會員,要發表迴響,請先登入
 3樓. Lingzi2010/03/30 23:51Control chart
http://en.wikipedia.org/wiki/Control_chart
Just a reference resource ~~ for someone like me, a laywoman ( or a layman)

Semiconductor manufacturing is beyong my scope....but the principles of quality control or assurance can be applied to some other areas.
Thanks for sharing.
I am touched.
Those guys have never treated my posting seriously. Although they probably are more experienced than me, I do feel belittled from time to time.
Thank you very much!
ricasso 於 2010/04/05 10:49回覆 2樓. tanifa2010/03/28 15:59解決問題
你需要交女朋友,女性朋友顯然不能解決你的問題。 1樓. pommel2010/03/28 14:53please
For the love of God, please write something digestable.


