你能想想以後的台灣長得什麼樣?
1.台北市將會形成東北-西南向的台北湖向基隆及三峽延伸。
(歷史可見,見稗海紀遊~郁永河,https://www.youtube.com/watch?v=lcMntFlk6LU)
2.桃竹苗人口密集區影響大、還有宜蘭也是。
3.台中市市區、大甲清水、沙鹿、彰化及員林,多半是會全部 在水面下。
4.斗六以南,將會以三號國道(二高)為界,以東為陸地,以西會全部在水面下。
5.澎湖會全部在水面下
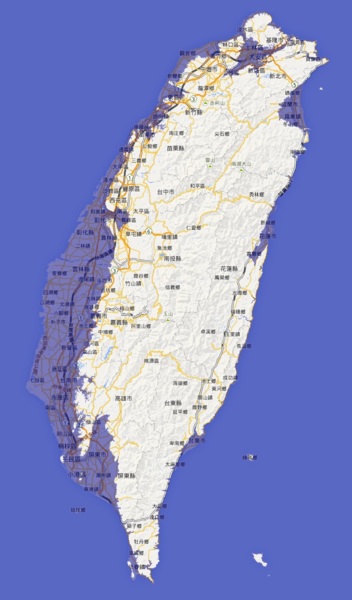
影像來源: http://flood.firetree.net/?ll=23.7476,121.0253&zoom=7&m=60
(上列網址是以Google地圖的北緯23.75度,東經121度以中心,放大率7級,模擬海水面上升60公尺) (Data provided by NASA)
底下是國外的BLOGGER短文: I’ve had loads of requests from people who want to put Flood Maps on their own web-site. Well, I’ve finally found a way to allow it, and still pay for my server. Just place the following IFRAME code on your site, and voila!(內嵌)
Note that the width and height of the IFRAME must be the same as the w and h parameters in the URL.
You can also add any of the following parameters to the URL:(控制碼) ll — lat/long, e.g. 57.0,-1.3 m — metres above sea level zoom — zoom level, up to a maximum zoom of 17. type — map type, roadmap|satellite|hybrid|terrain You can copy all of these parameters from the link in the bottom-left corner of the Flood Maps page.
Just navigate until you find the scene you want, and then copy the URL parameters into the above HTML fragment. The frame contains a Google ad-unit, which should make enough money to offset the cost of serving all the additional map tiles.(2007) http://blog.firetree.net/2007/02/06/flood-maps-on-your-web-site/


 4樓. edd2015/01/15 01:11
-
3樓. edd2015/01/15 01:00
-
2樓. edd2015/01/15 00:42網站模擬
firetree.net利用了Google Maps的圖和NASA提供的高度資料,製作了一個模擬網站,顯示當海平面升高時陸地的殘存情況。你只要在左上角選擇一個海平面升高的程度,然後在地圖上找到你家的位置,就可以知道結果了。如果你家沒有任何的改變,恭喜你,在未來你可以先不用擔憂搬家的問題。但如果你家被一塊藍色塊覆蓋,那麼你還是努力地拯救這個世界和你自己吧!
 1樓. 時和2014/03/29 13:18山坡住宅社區 最好的廣告
北市有135處山坡住宅社區 最好的廣告


