這兩天上課的筆記
小小段剛開始學
還挺好玩的! ( 雖然打指令很難,但每摸出一個,就成就感加倍阿! )
使用軟體:MATLAB 6.5
試繪製以下參數的圖形
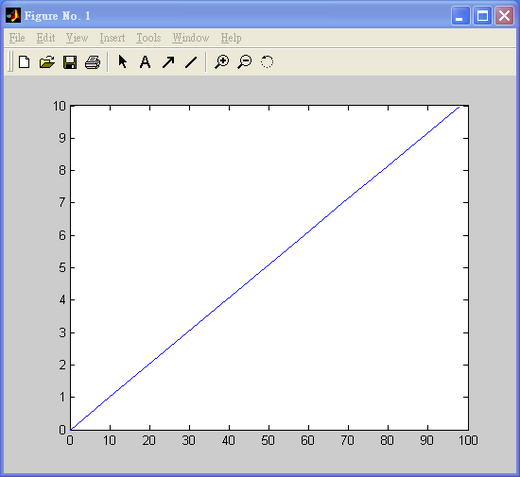
g = 9.8 ; t = 0~10 ; w = g*t ; s = 0.5 * g * t. *t
>> g=9.8
g =
9.8000
>> t=0:10
t =
0 1 2 3 4 5 6 7 8 9 10
>> w=g*t
w =
0 9.8000 19.6000 29.4000 39.2000 49.0000 58.8000 68.6000 78.4000 88.2000 98.0000
>> s=0.5*g*t.*t
s =
0 4.9000 19.6000 44.1000 78.4000 122.5000 176.4000 240.1000 313.6000 396.9000 490.0000
>> plot(w,t)
嘗試了一些指令
plot(A,B,'○')
在○中輸入一些字元或是符號在圖中會出現的情況
b blue . point - solid
g green o circle : dotted
r red x x-mark -. dashdot
c cyan + plus -- dashed
m magenta * star
y yellow s square
k black d diamond
v triangle (down)
^ triangle (up)
< triangle (left)
> triangle (right)


